Solar Installation Monitor
A Pi-based status box for a US solar installer — four red/green LEDs that mirror whether the installation's networked devices are answering, plus a Django admin for configuration. Shipped end-to-end in 48 hours and built to sit unattended in the field for years.
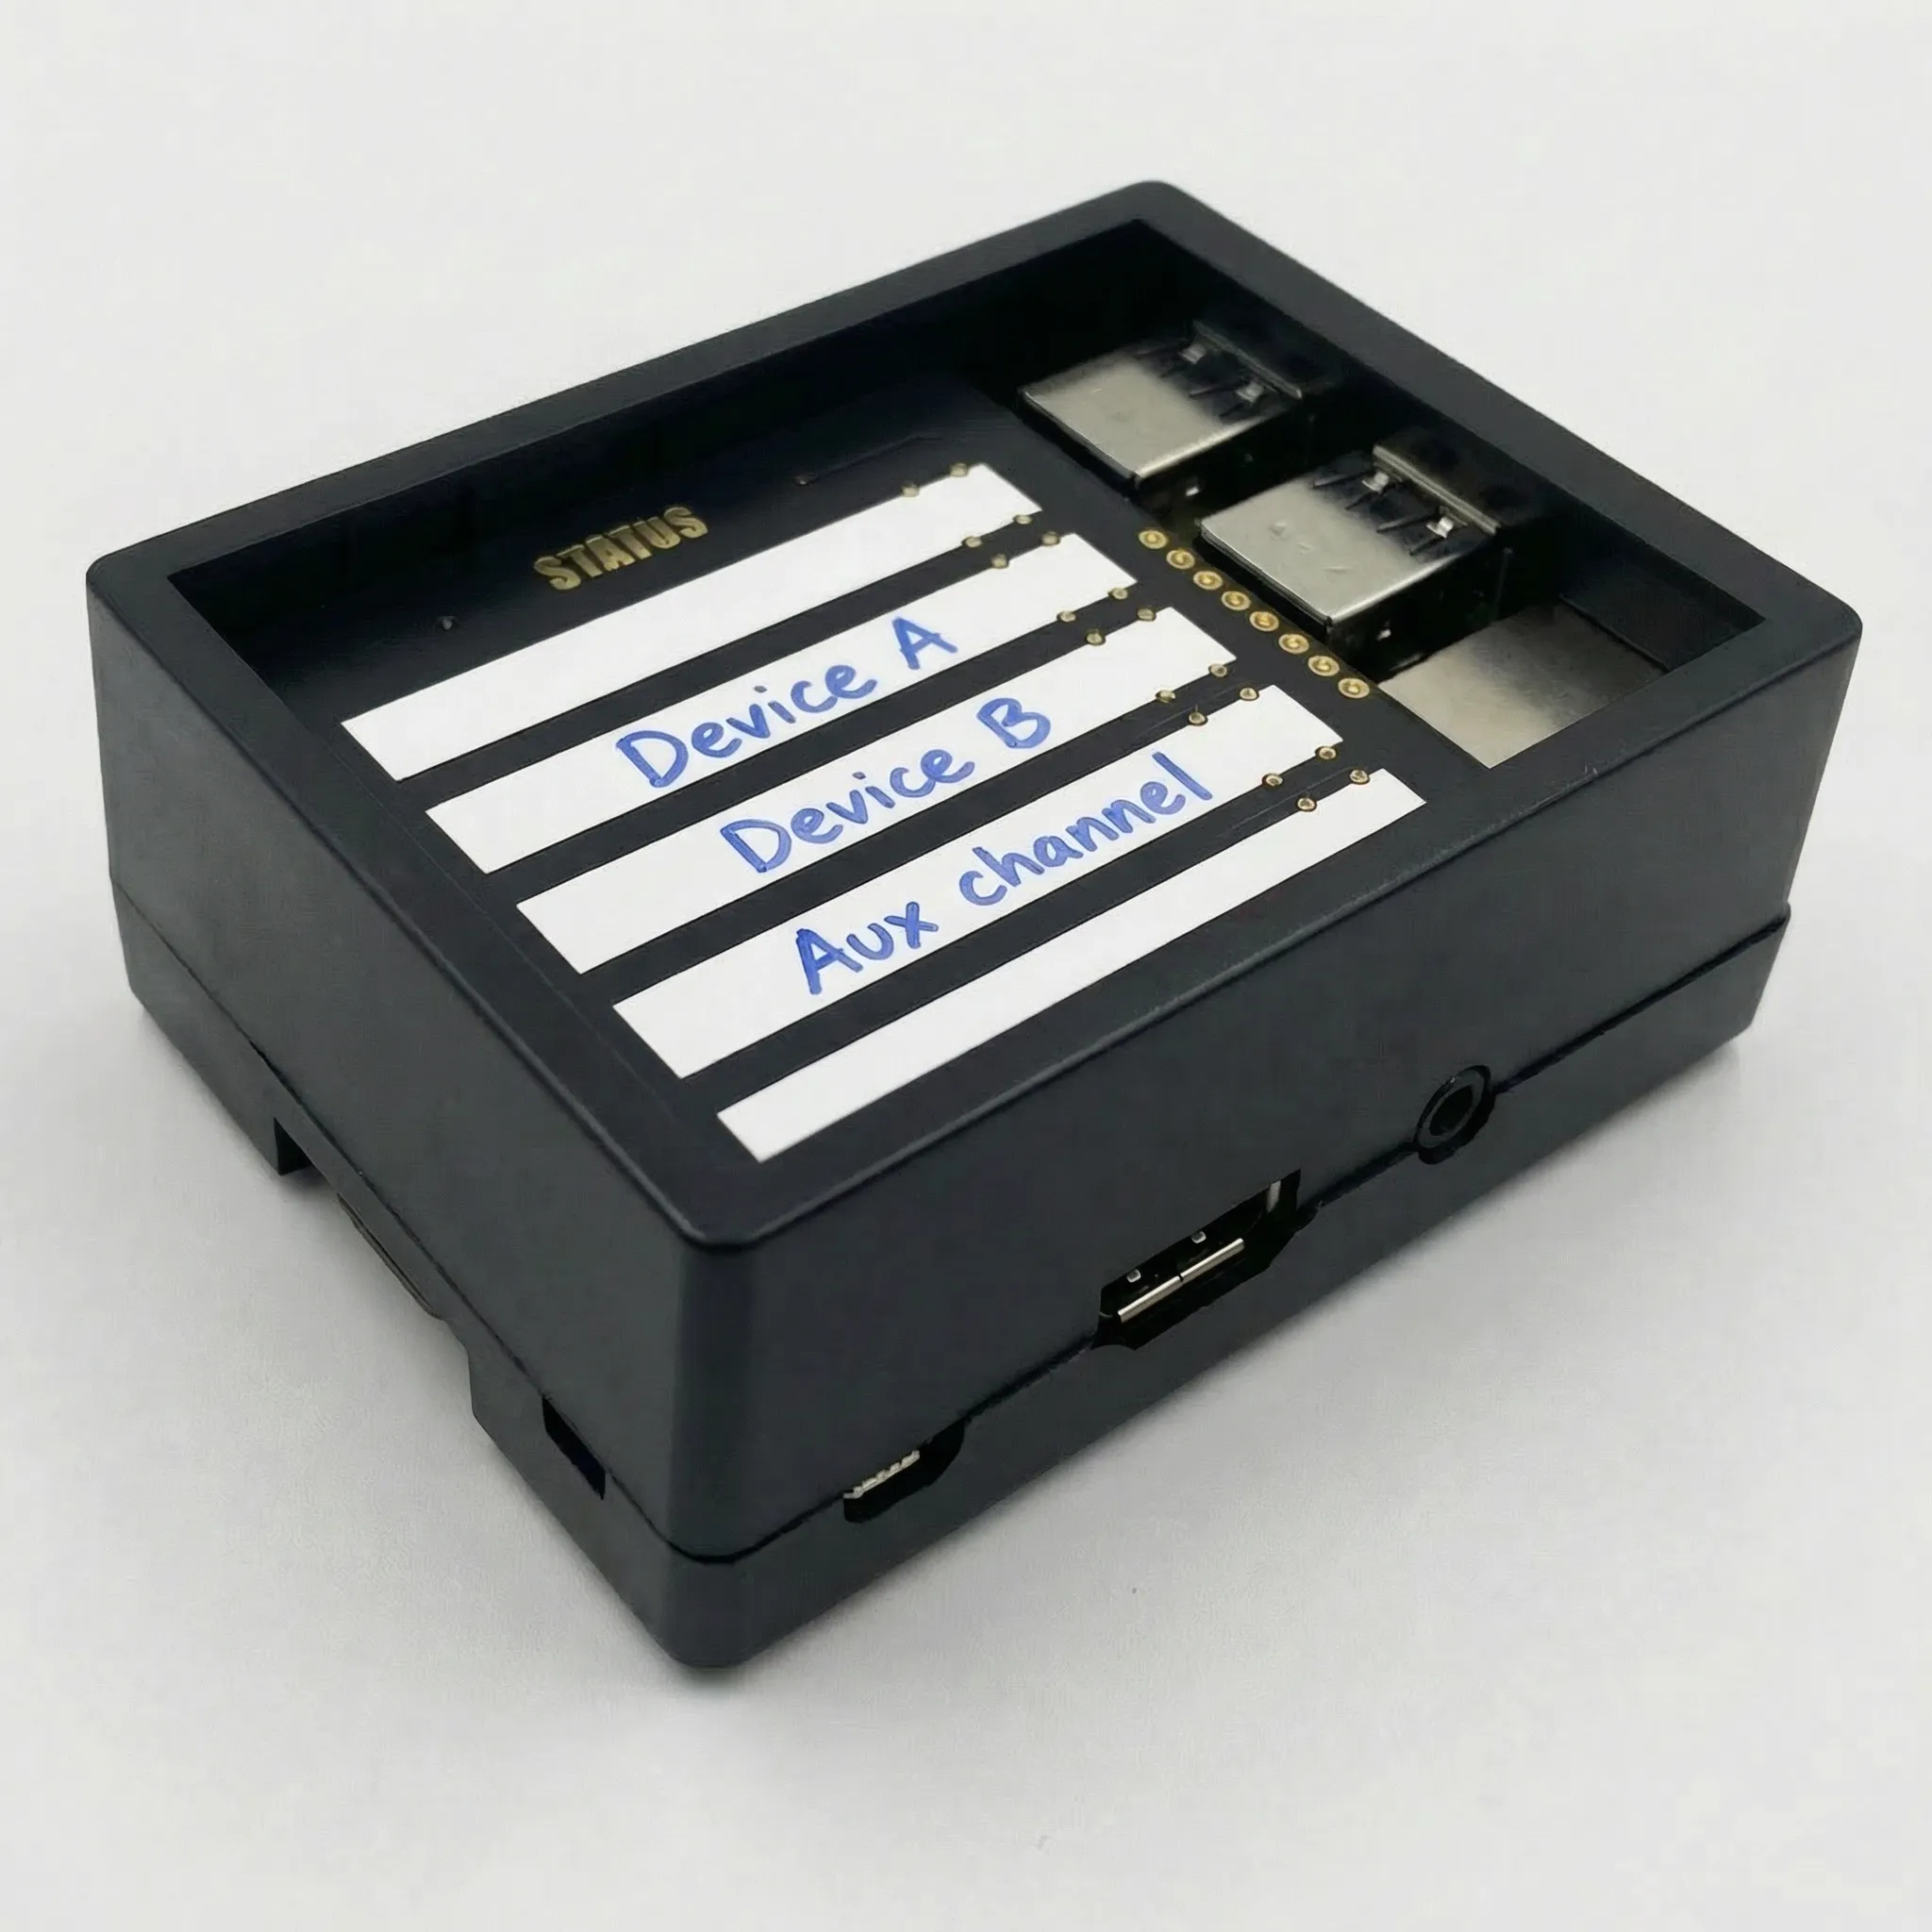
Confidence, not a dashboard
A US solar installer wanted to give clients a simple, physical answer to "is my system running?" — not another tab in a browser. Each installation has four networked devices, and the right signal is the one you can read from across the room: green means talking, dark means something's wrong. The installer also needed a way to configure each box per site — device IPs, ping intervals, network settings — without complexities of logging in over SSH.
Pi, hat, LEDs
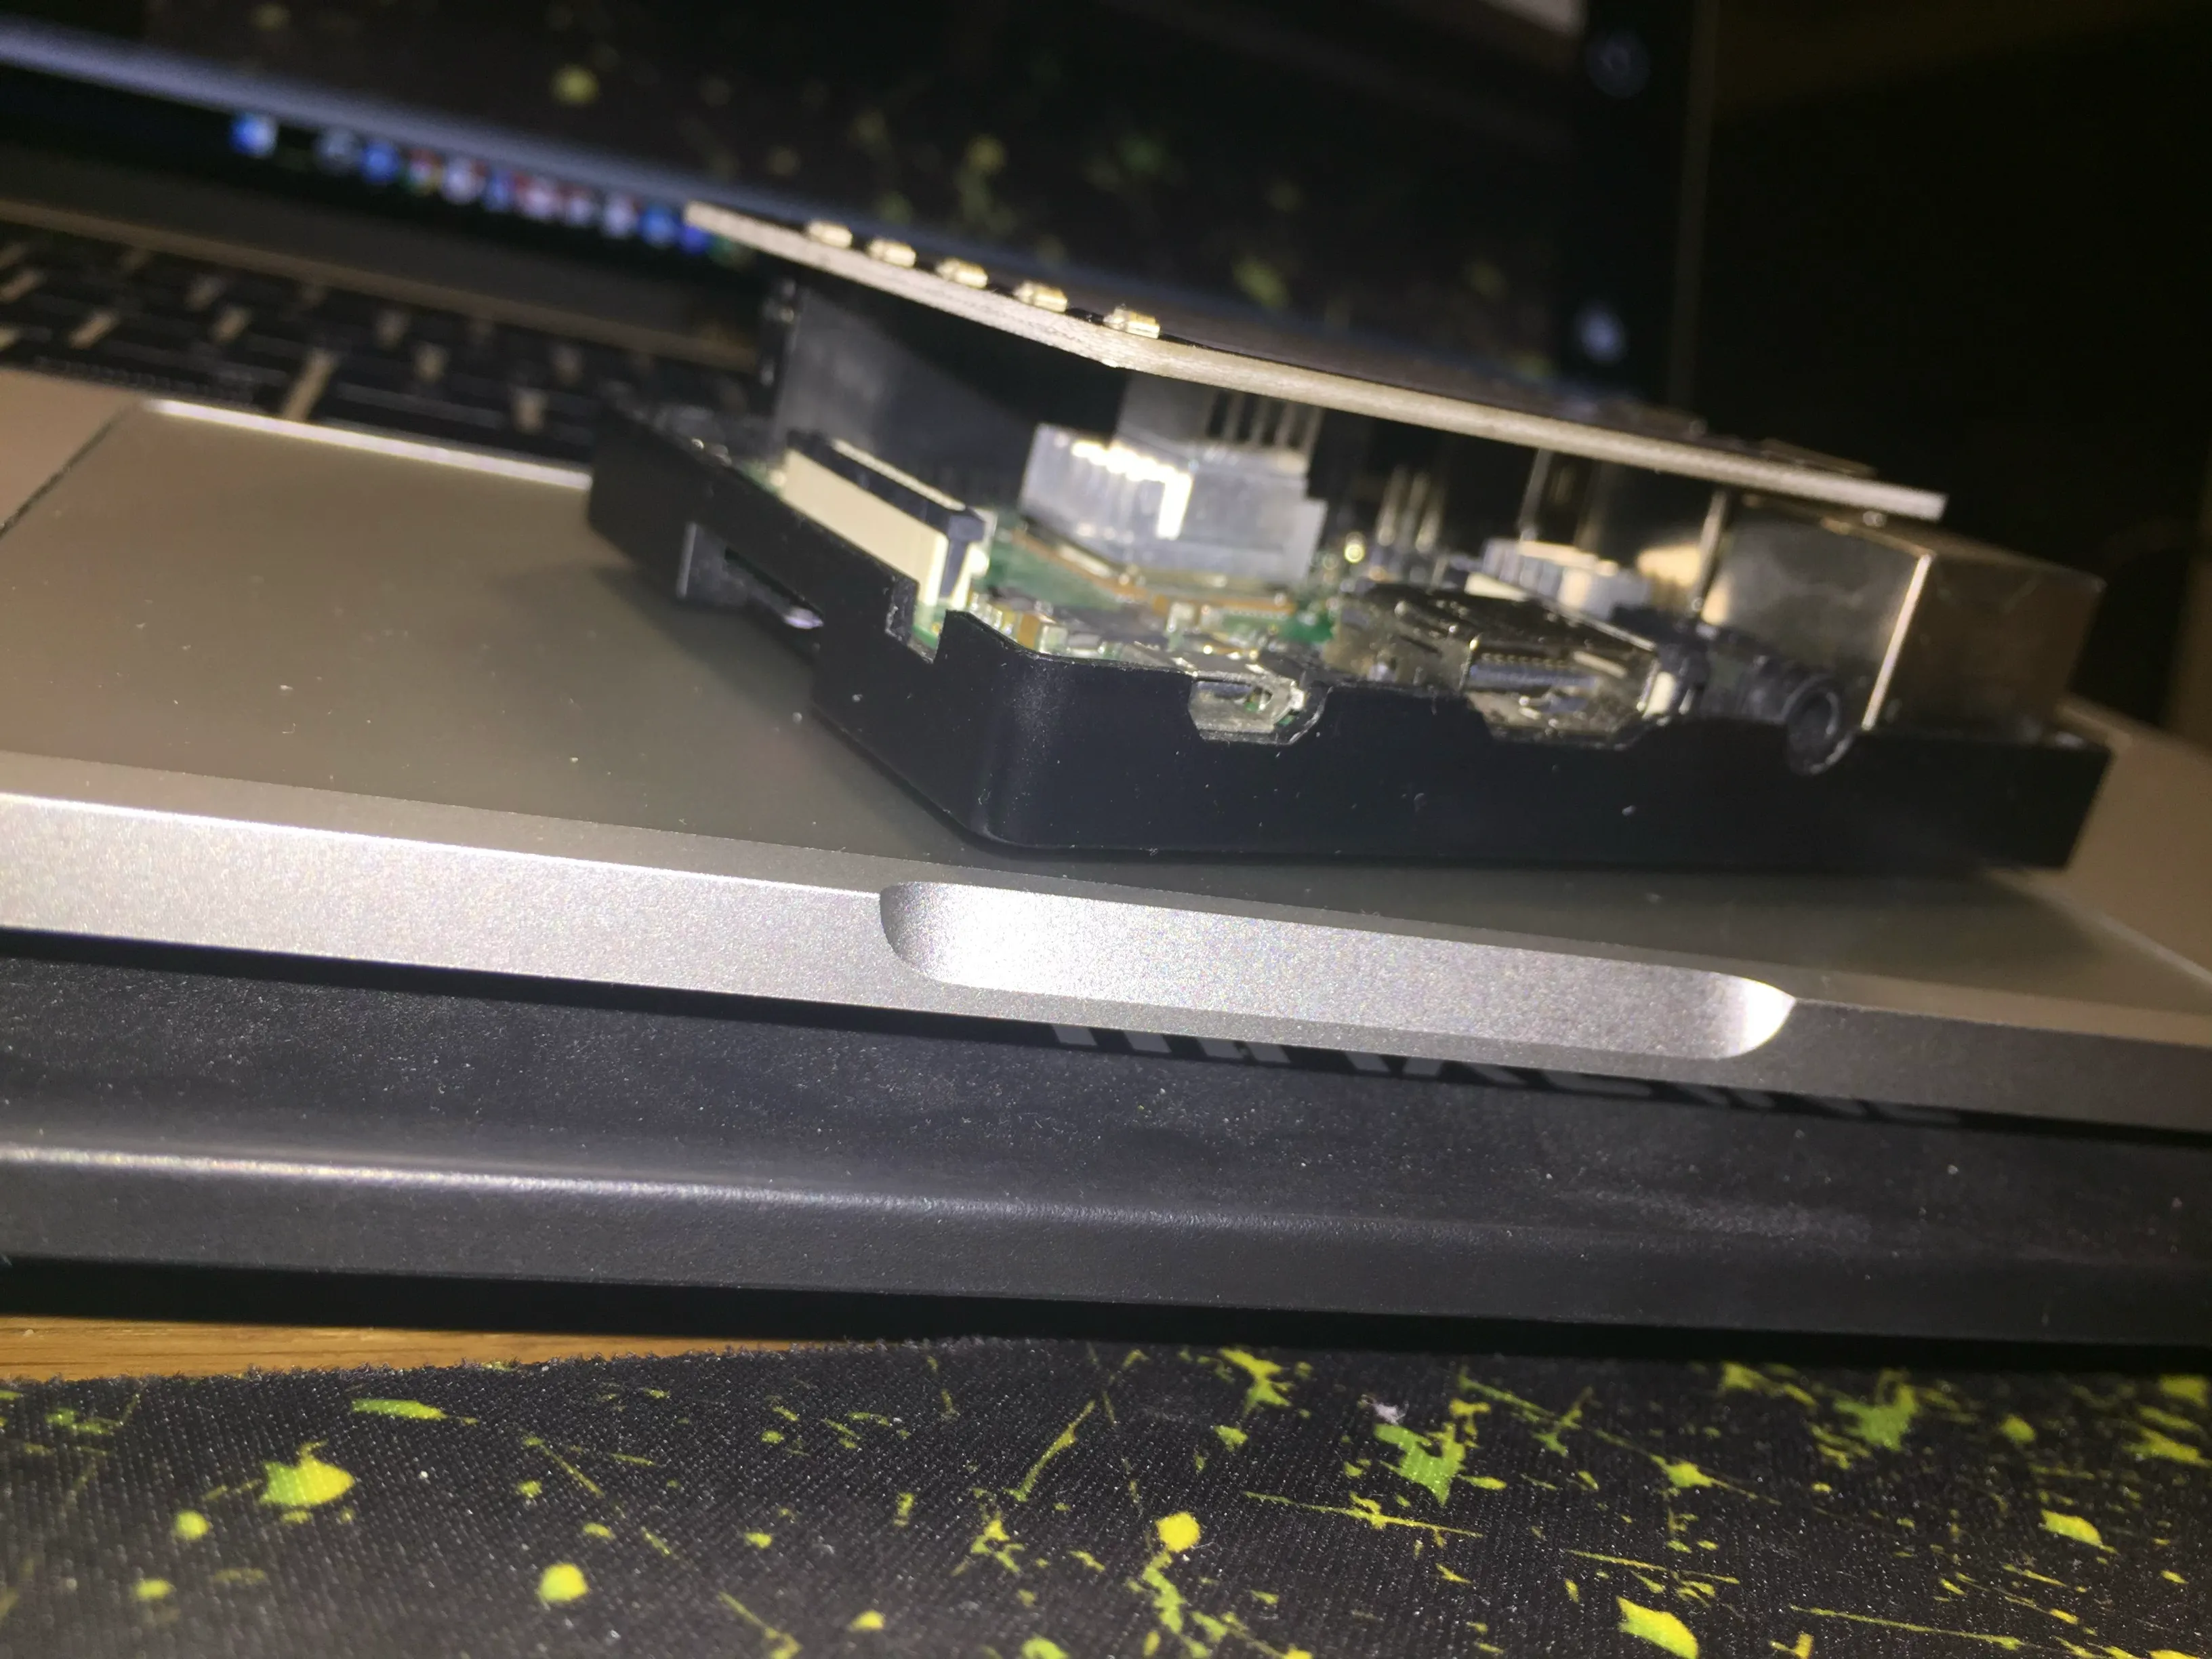
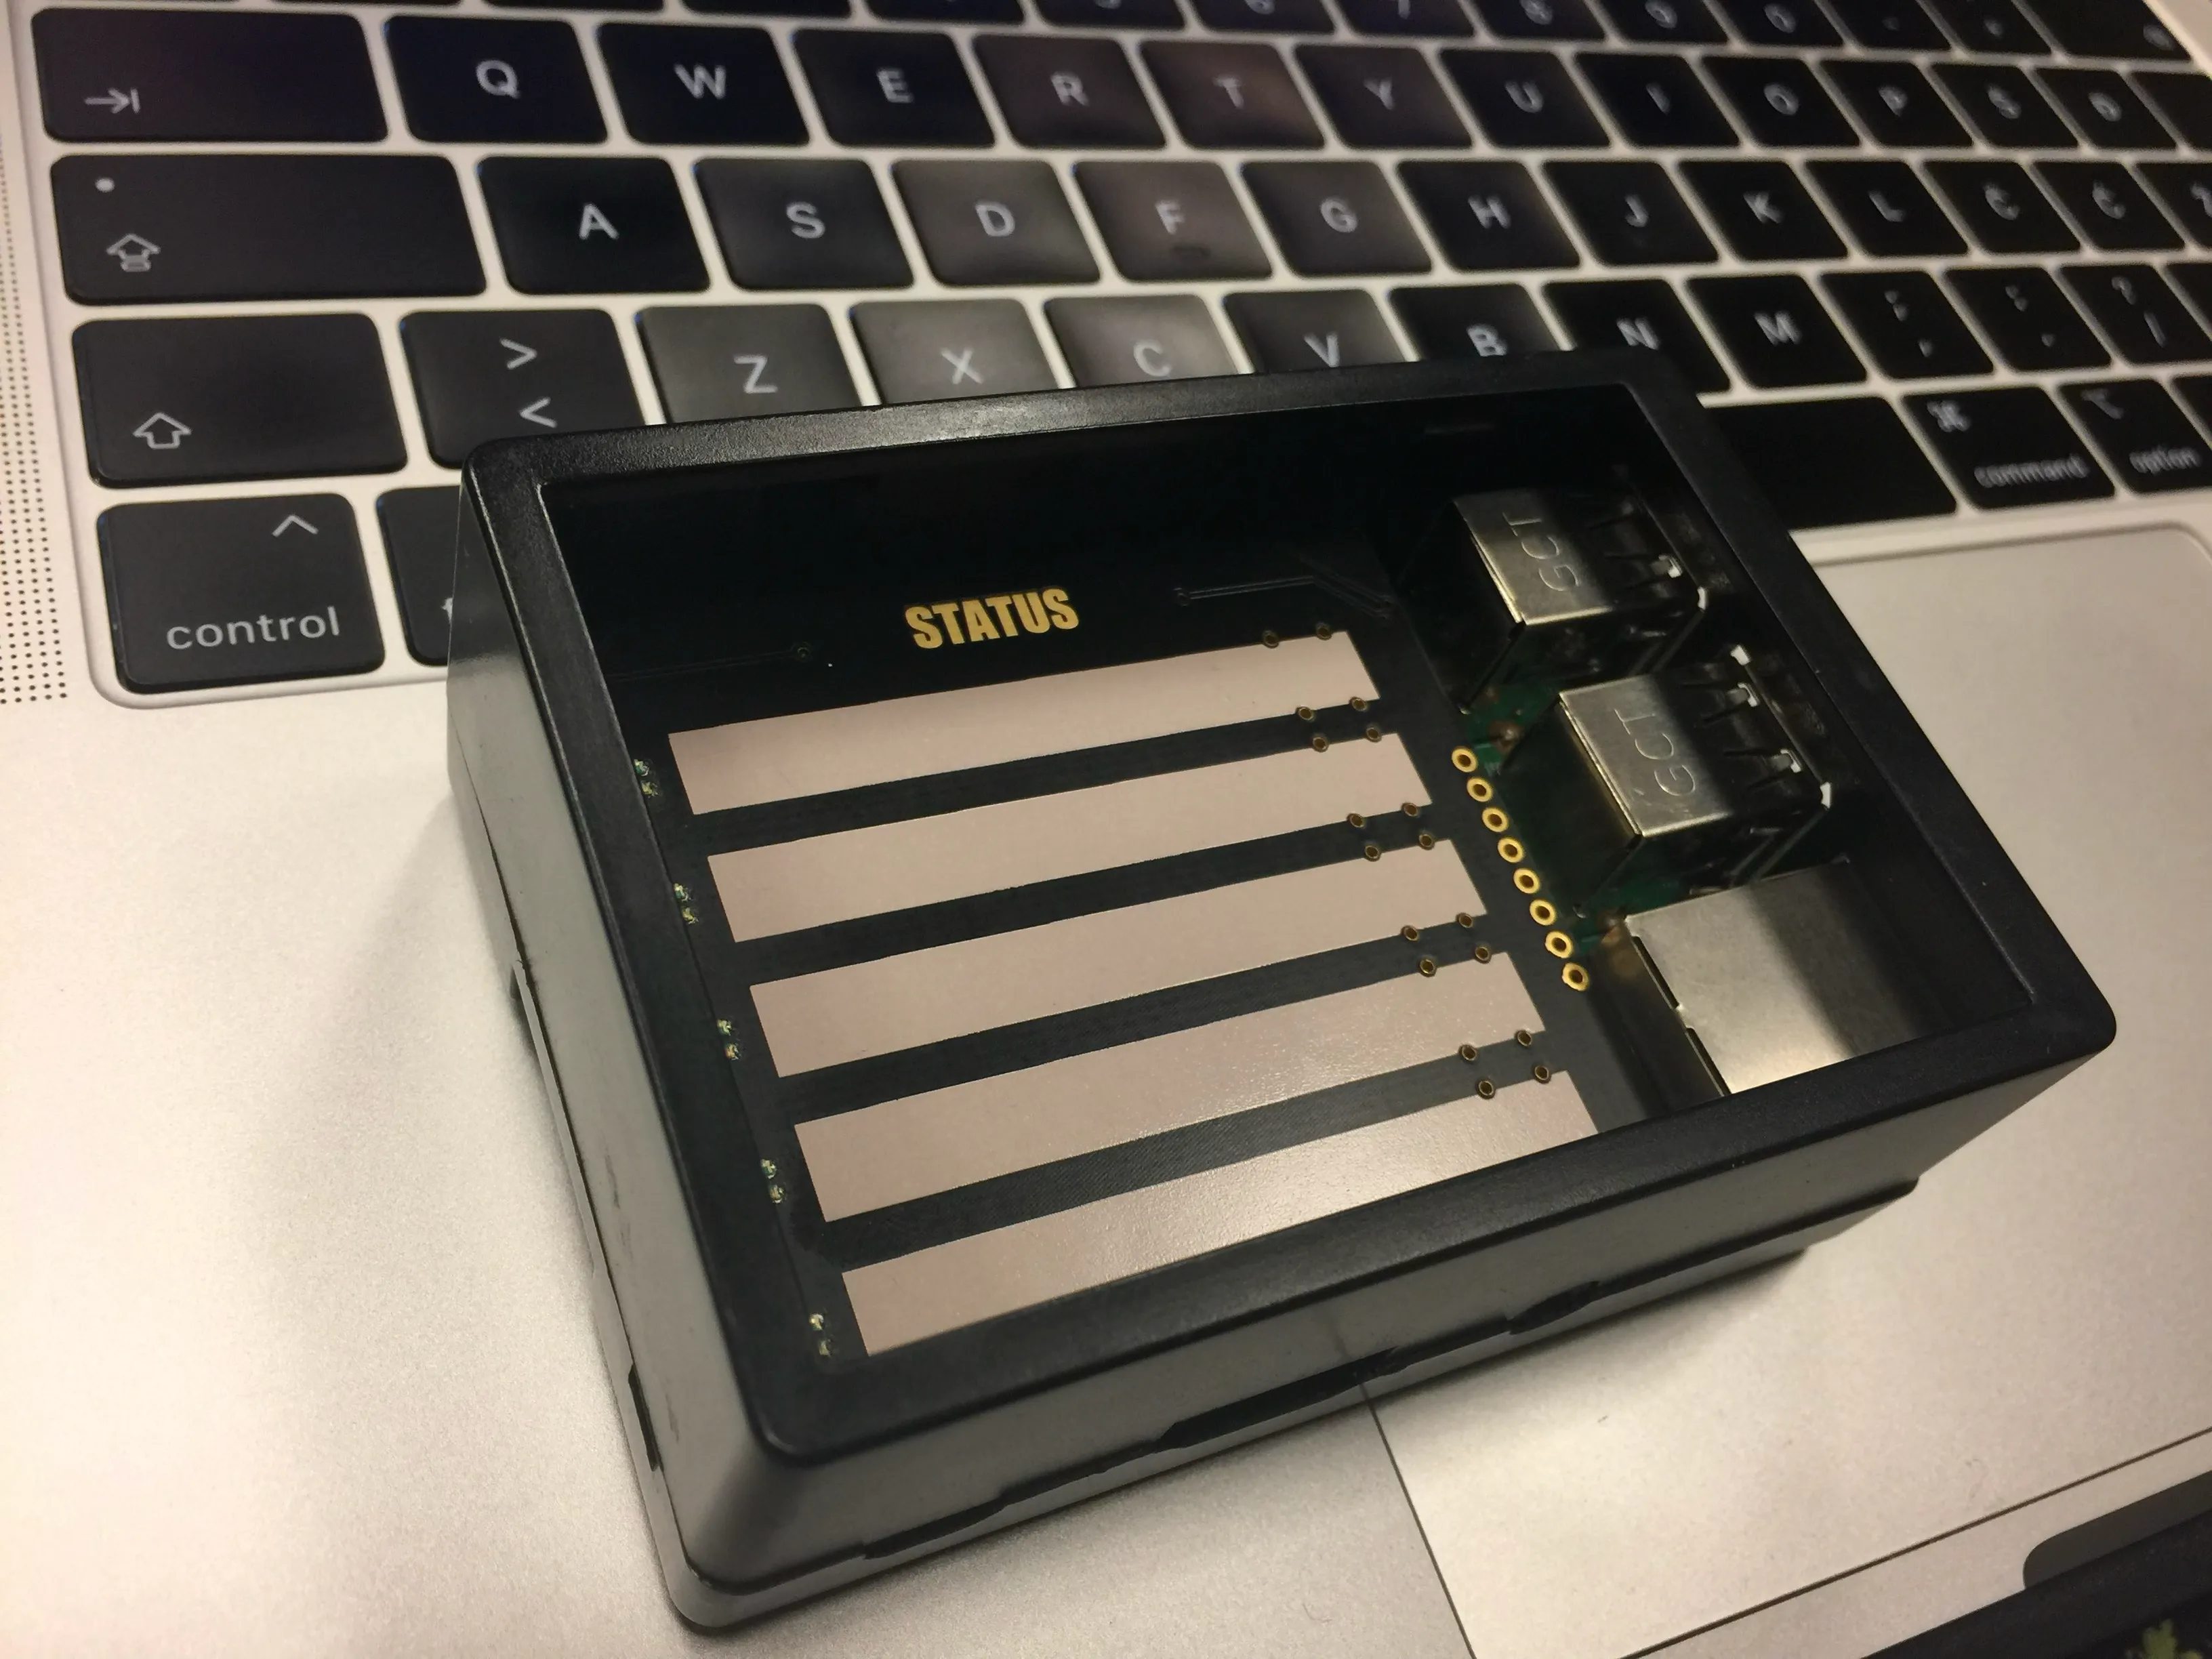
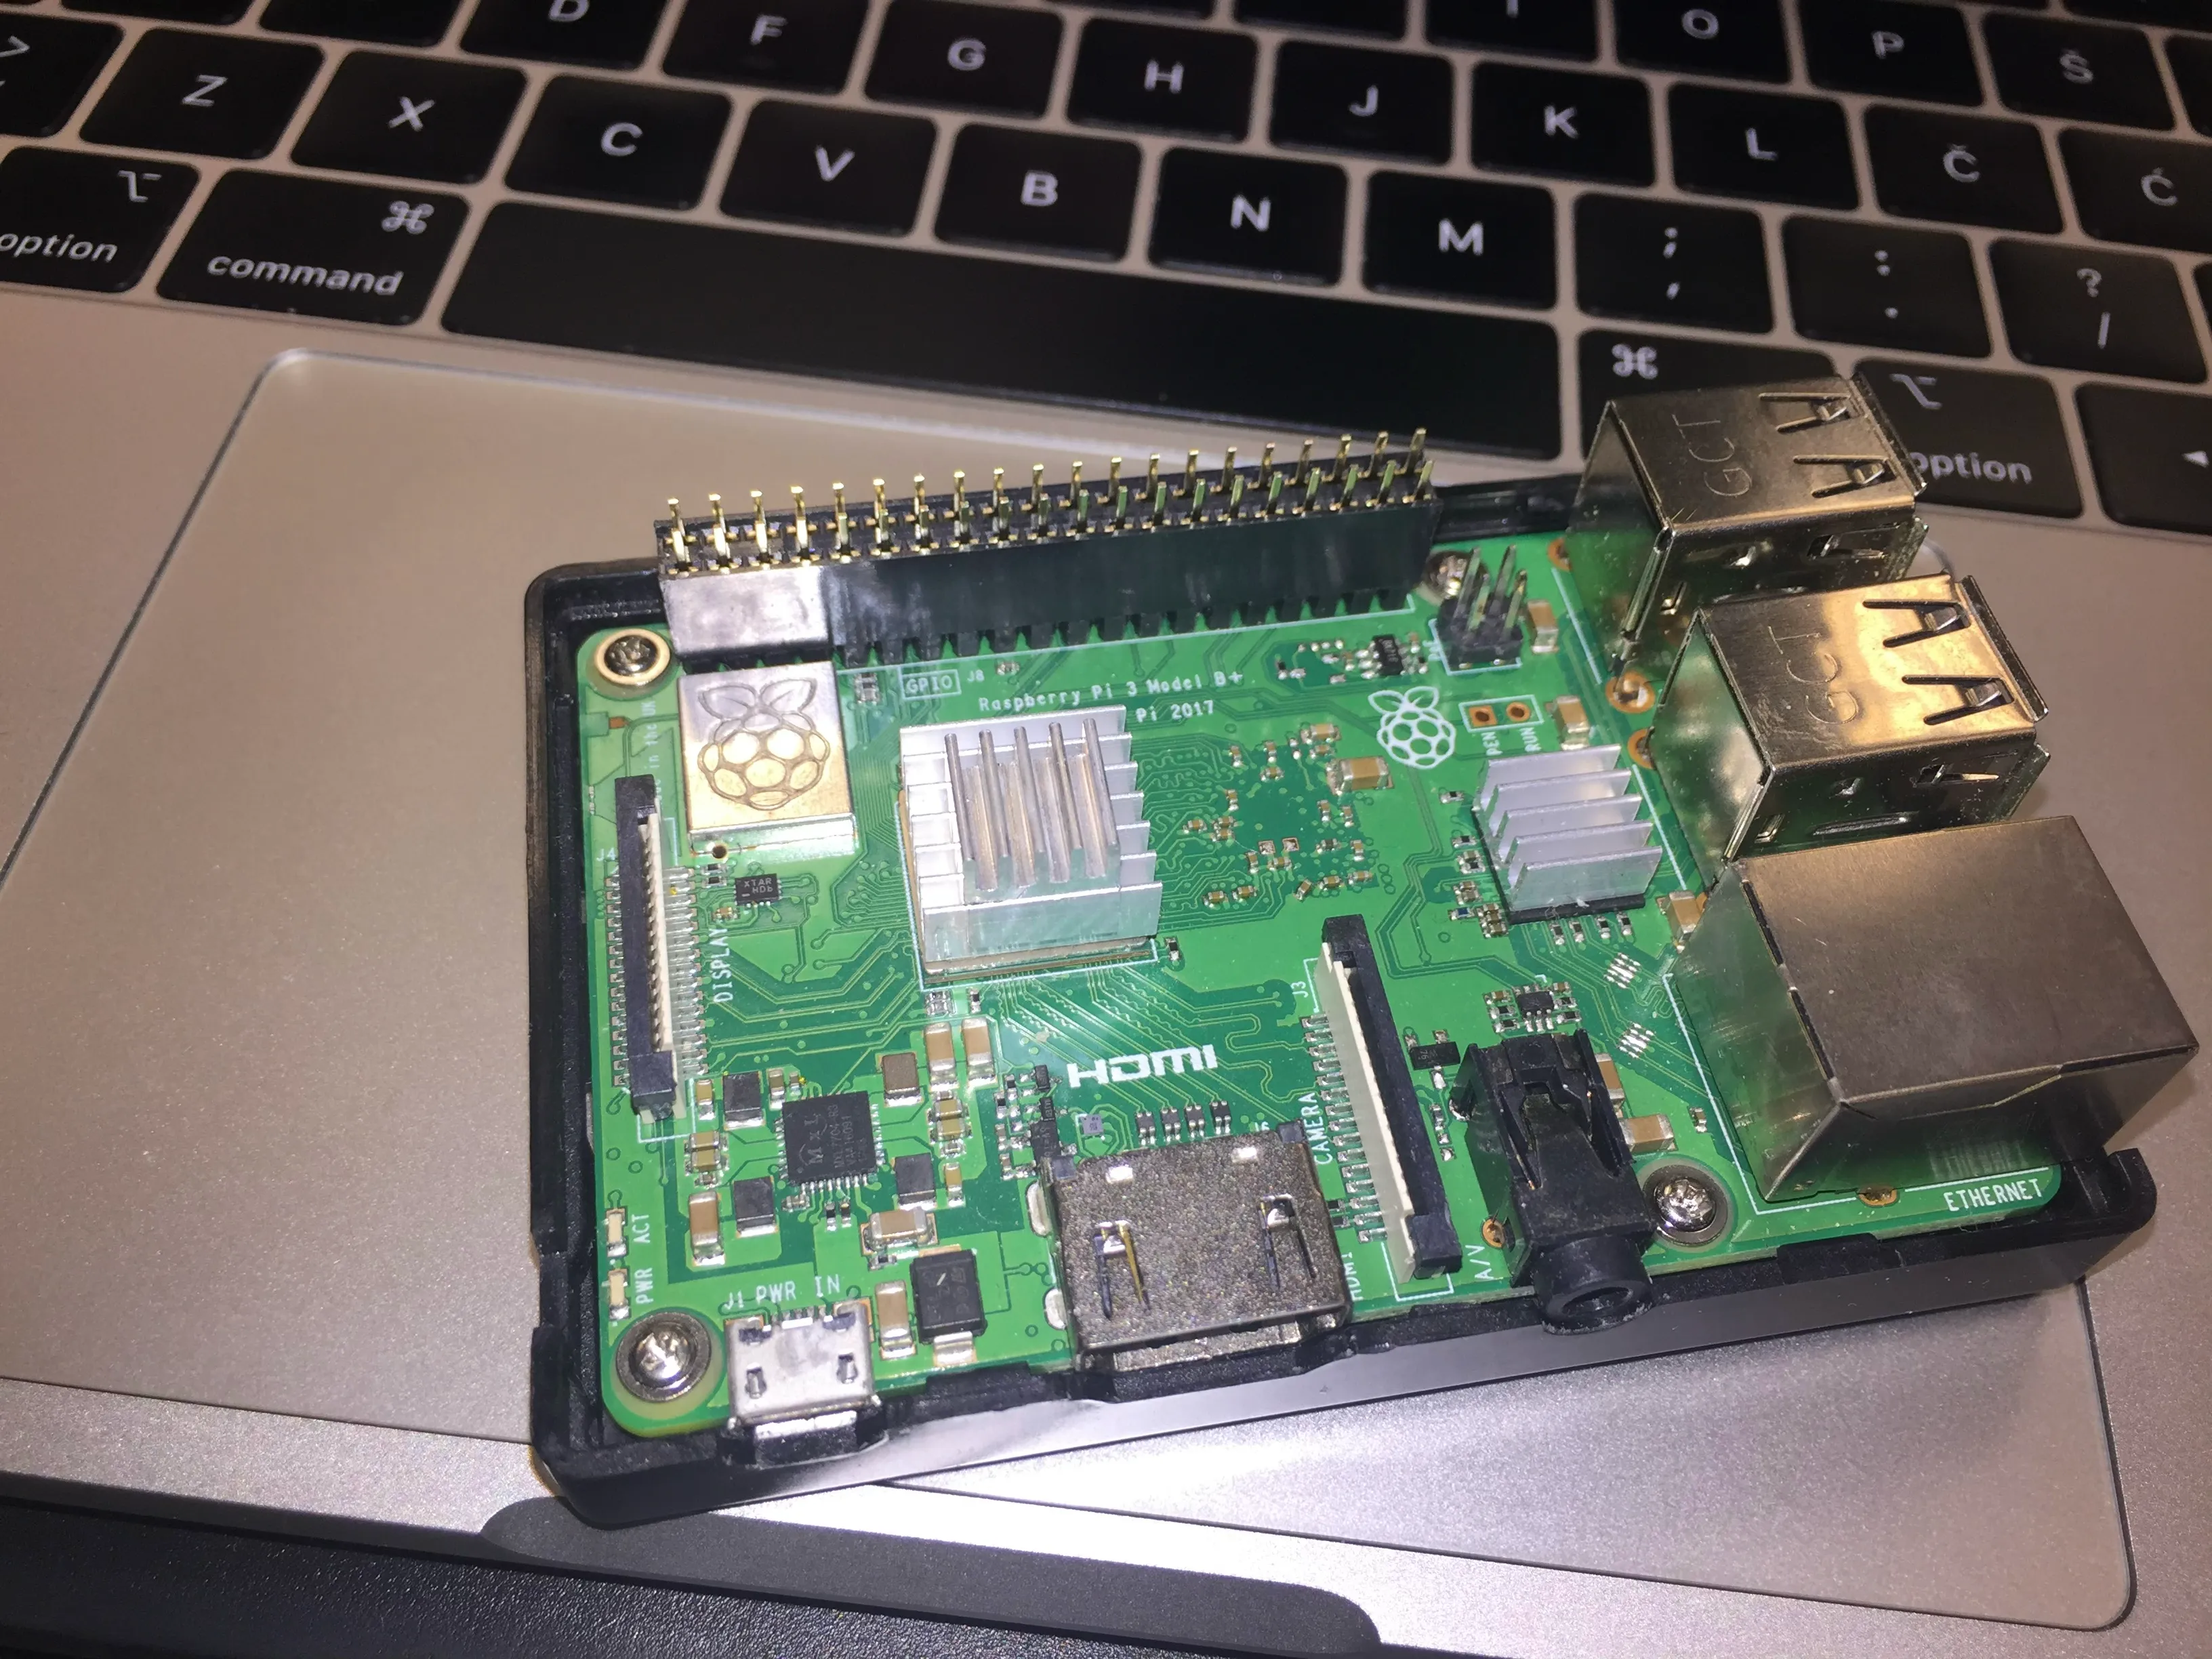
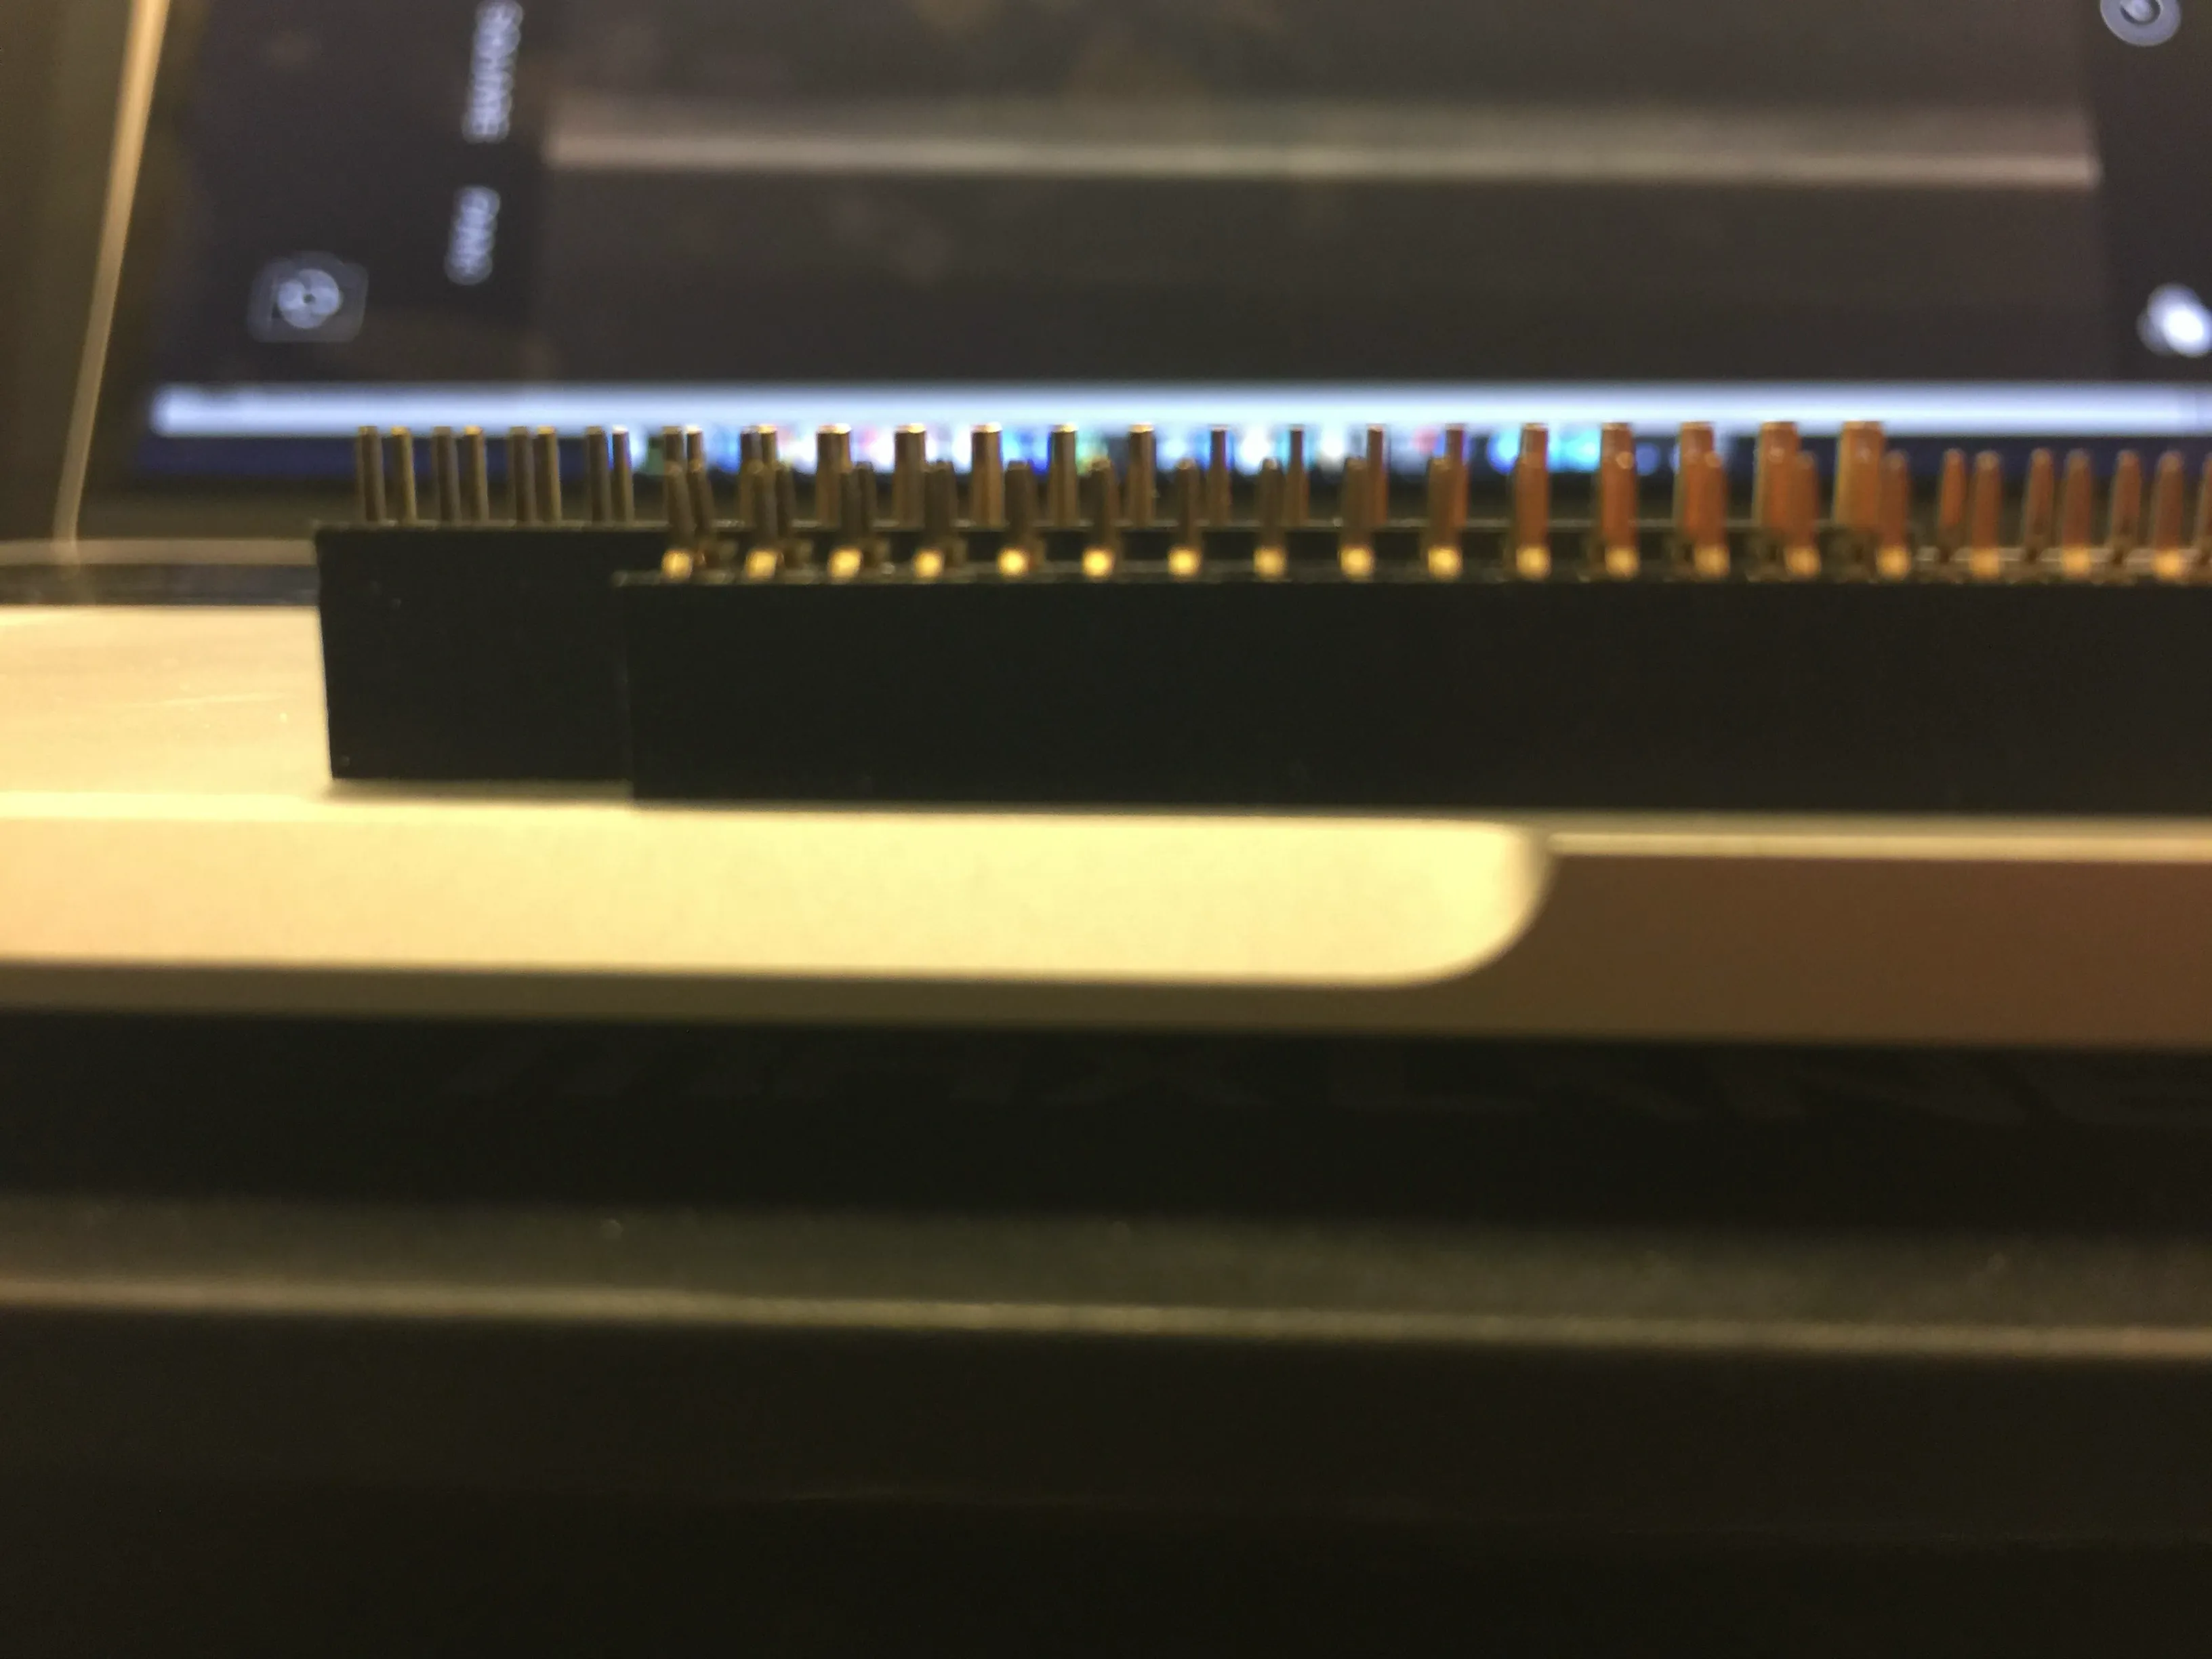
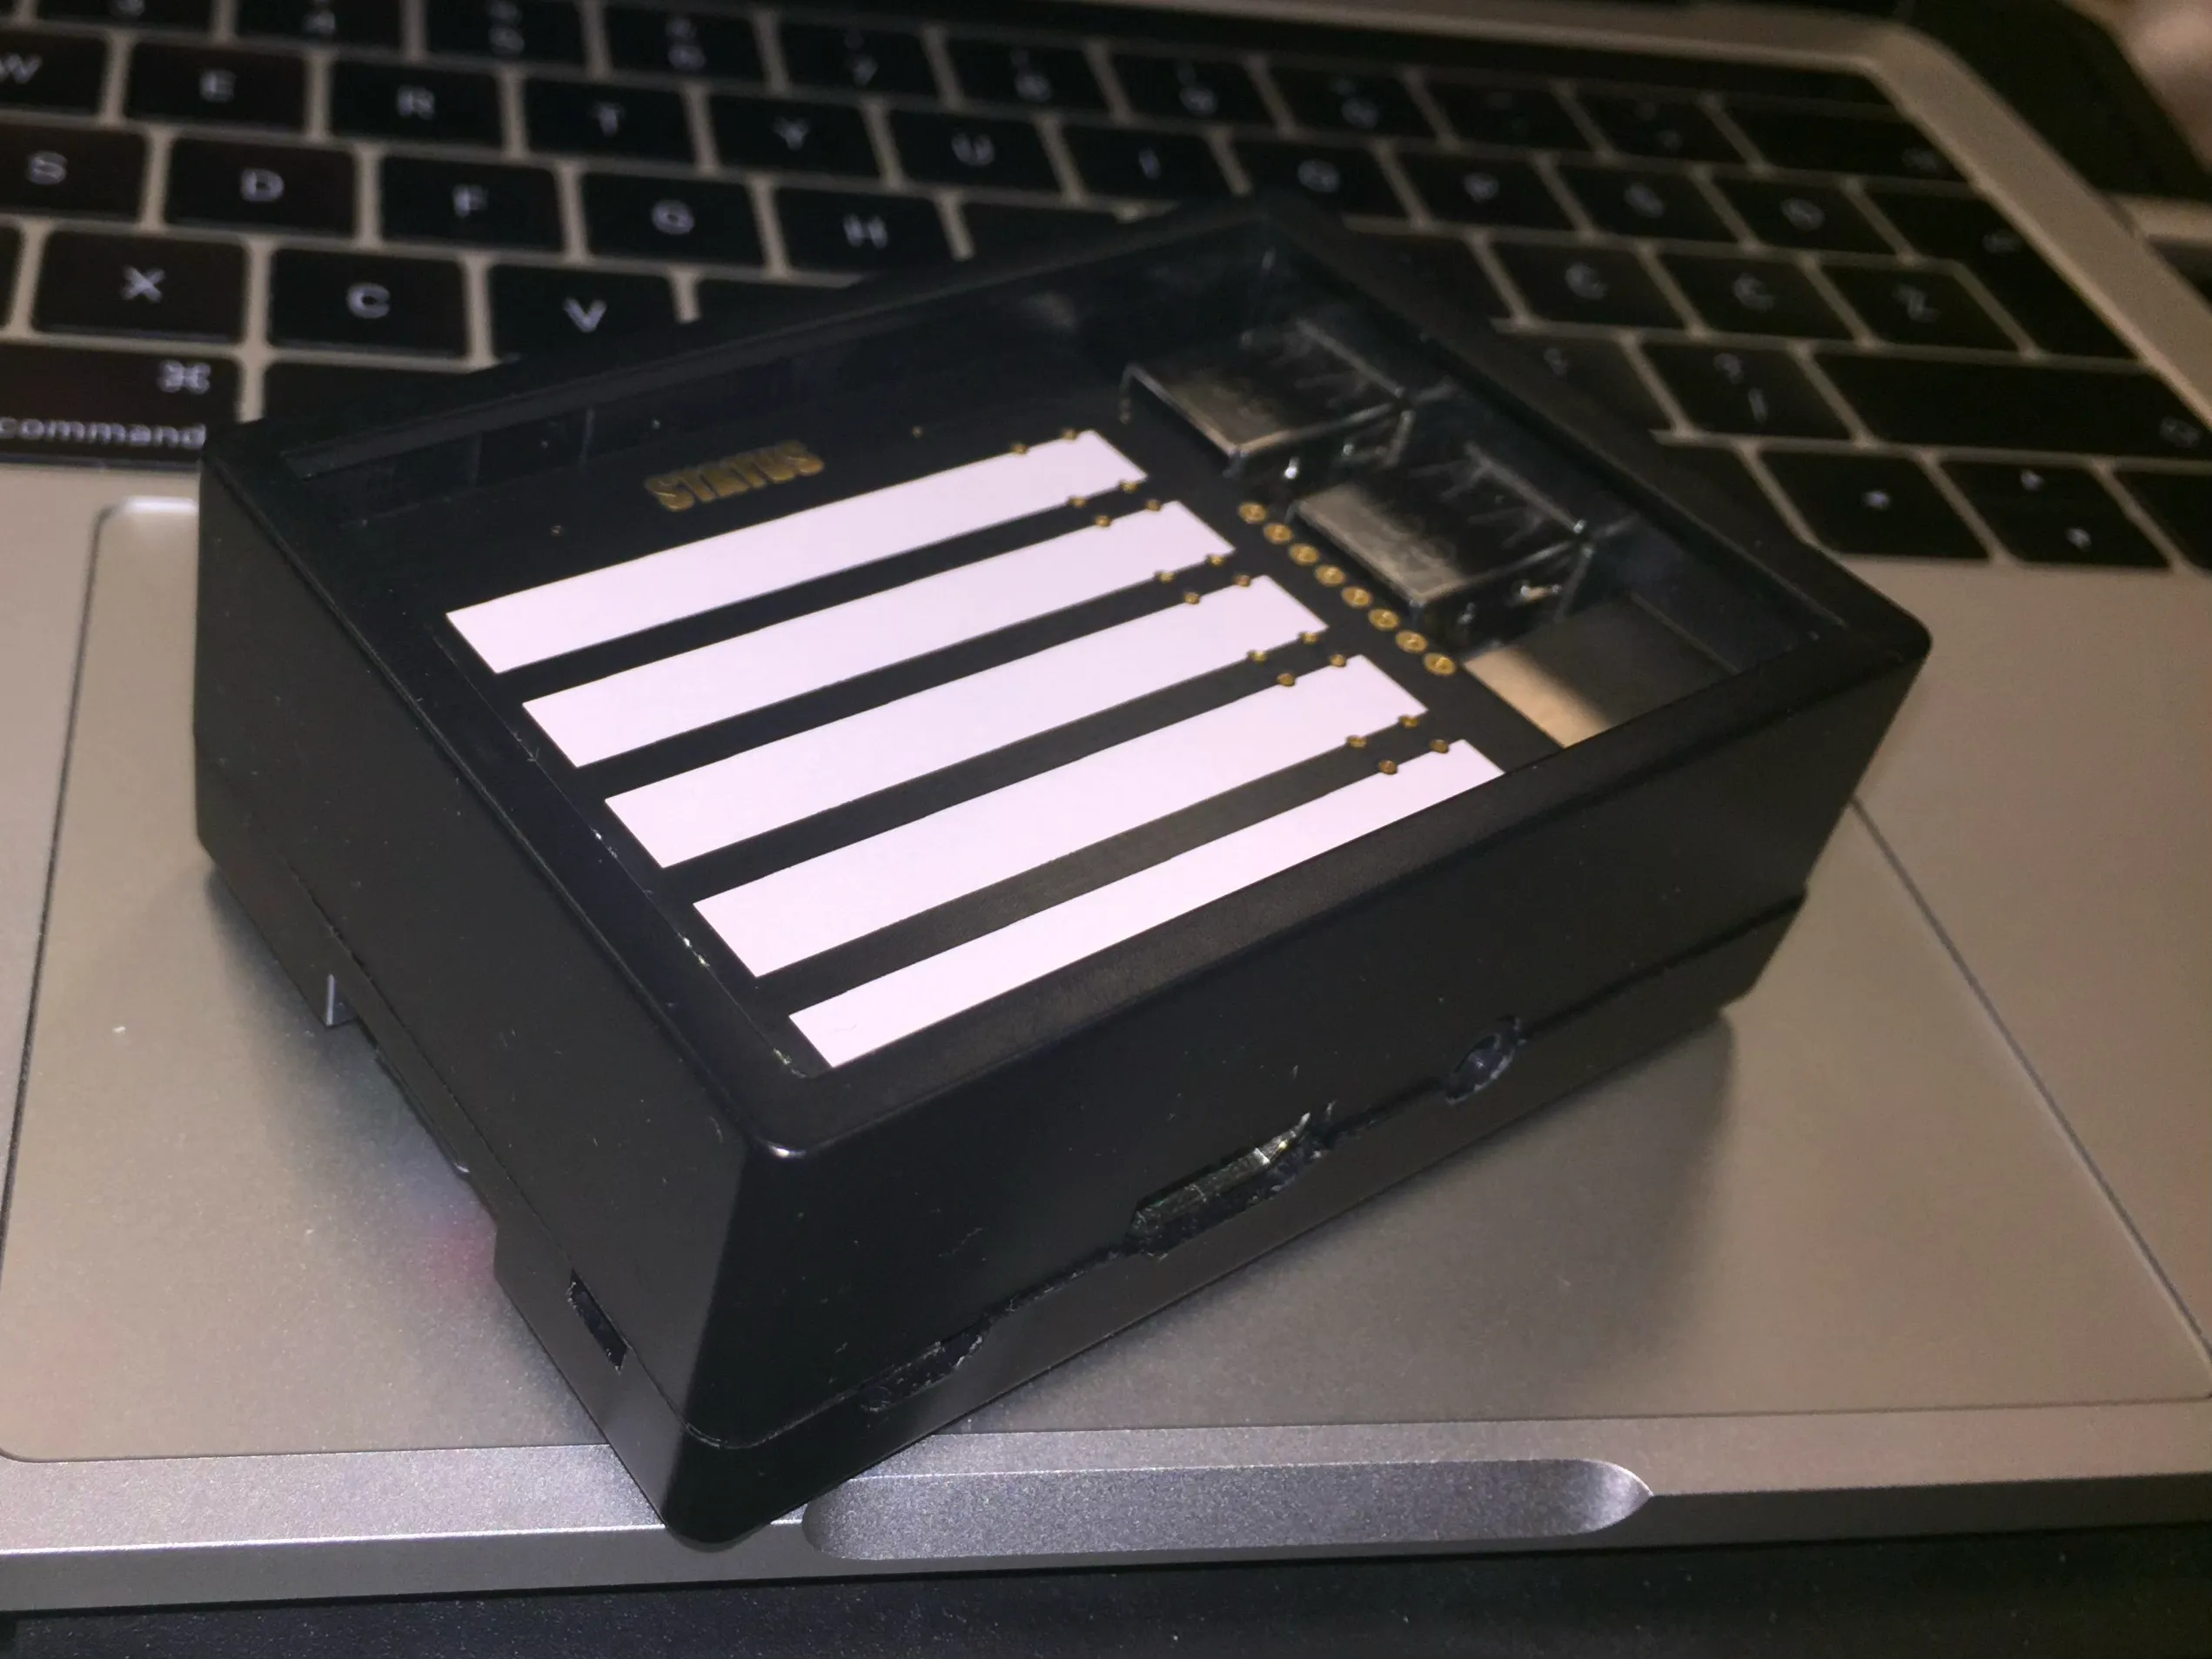
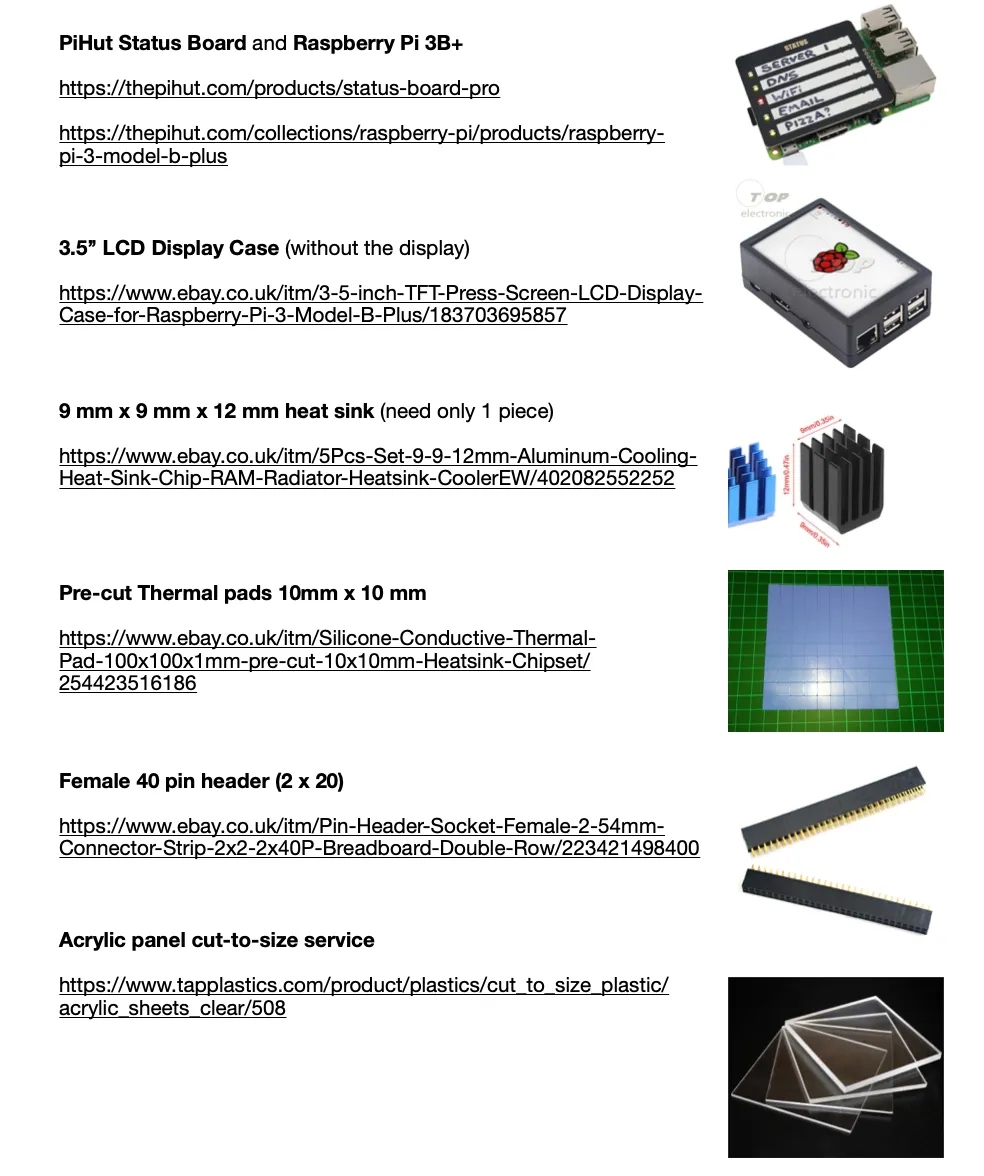
The box is a Raspberry Pi fitted with a PiHut StatusBoard Pro hat, driving up to five red/green LED strips through GPIO. A Celery worker handles the background pinging. Each device has its own ping interval and failure threshold — for example, three missed pings at 30 seconds before the LED flips red — and those thresholds are tuned per installation from the admin. Everything lives in one off-the-shelf enclosure that the installer opens, plugs in, and leaves.
Django admin is the UI
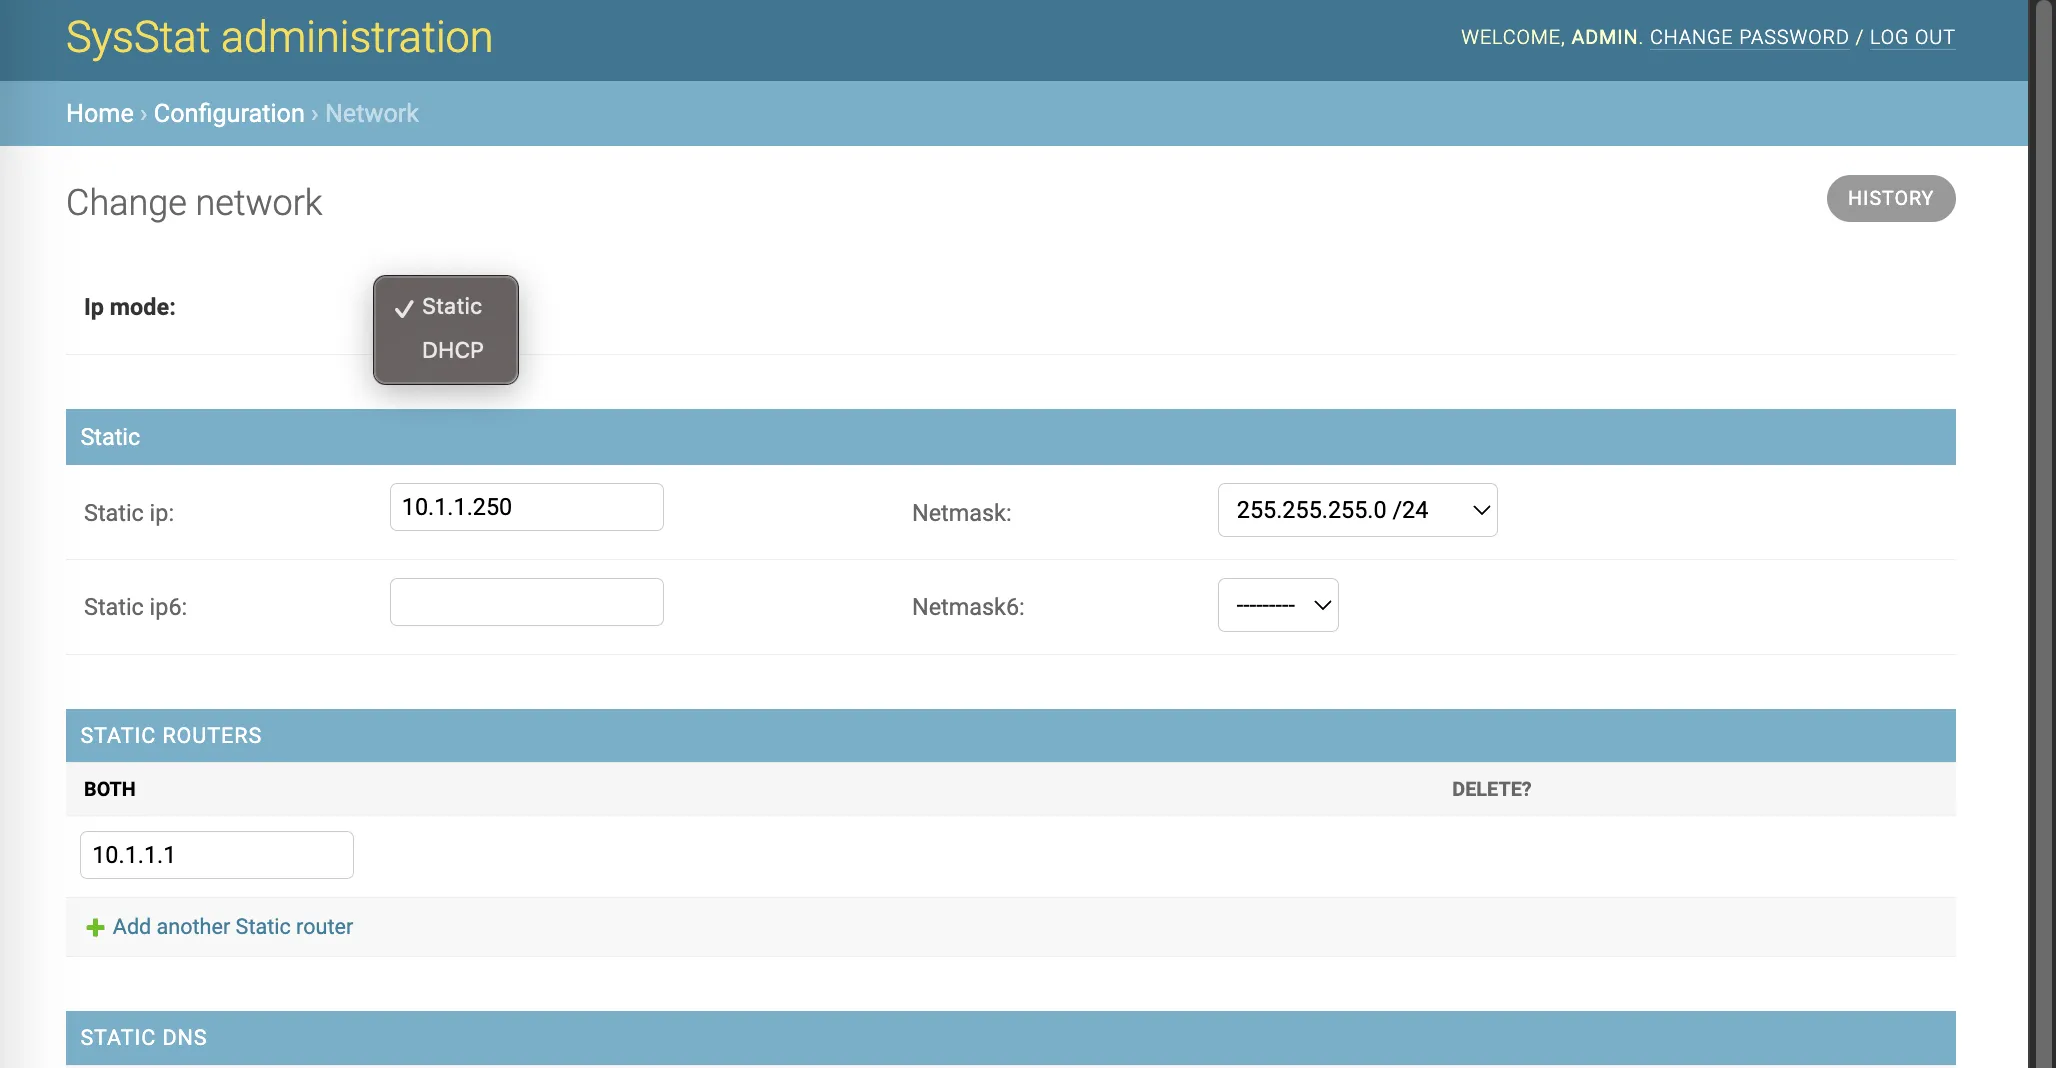
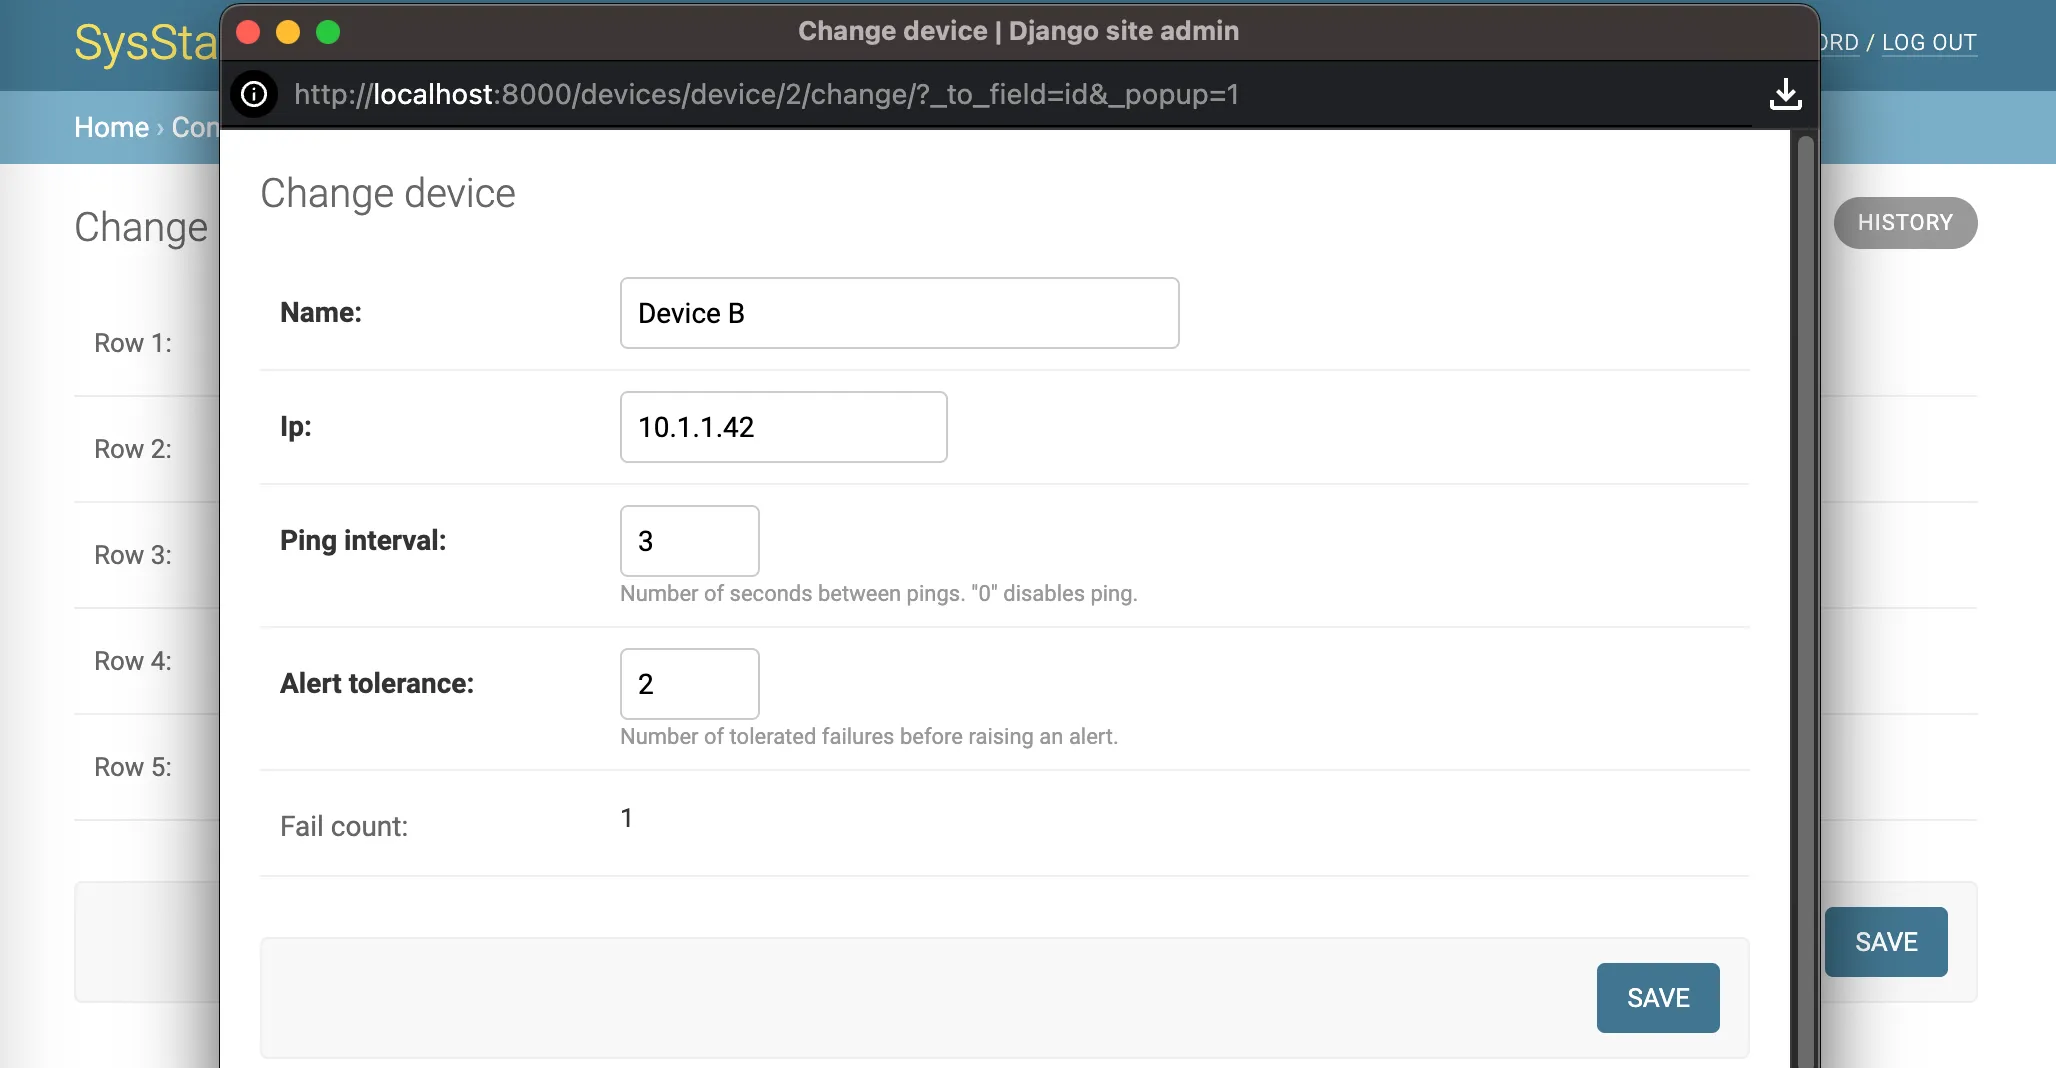
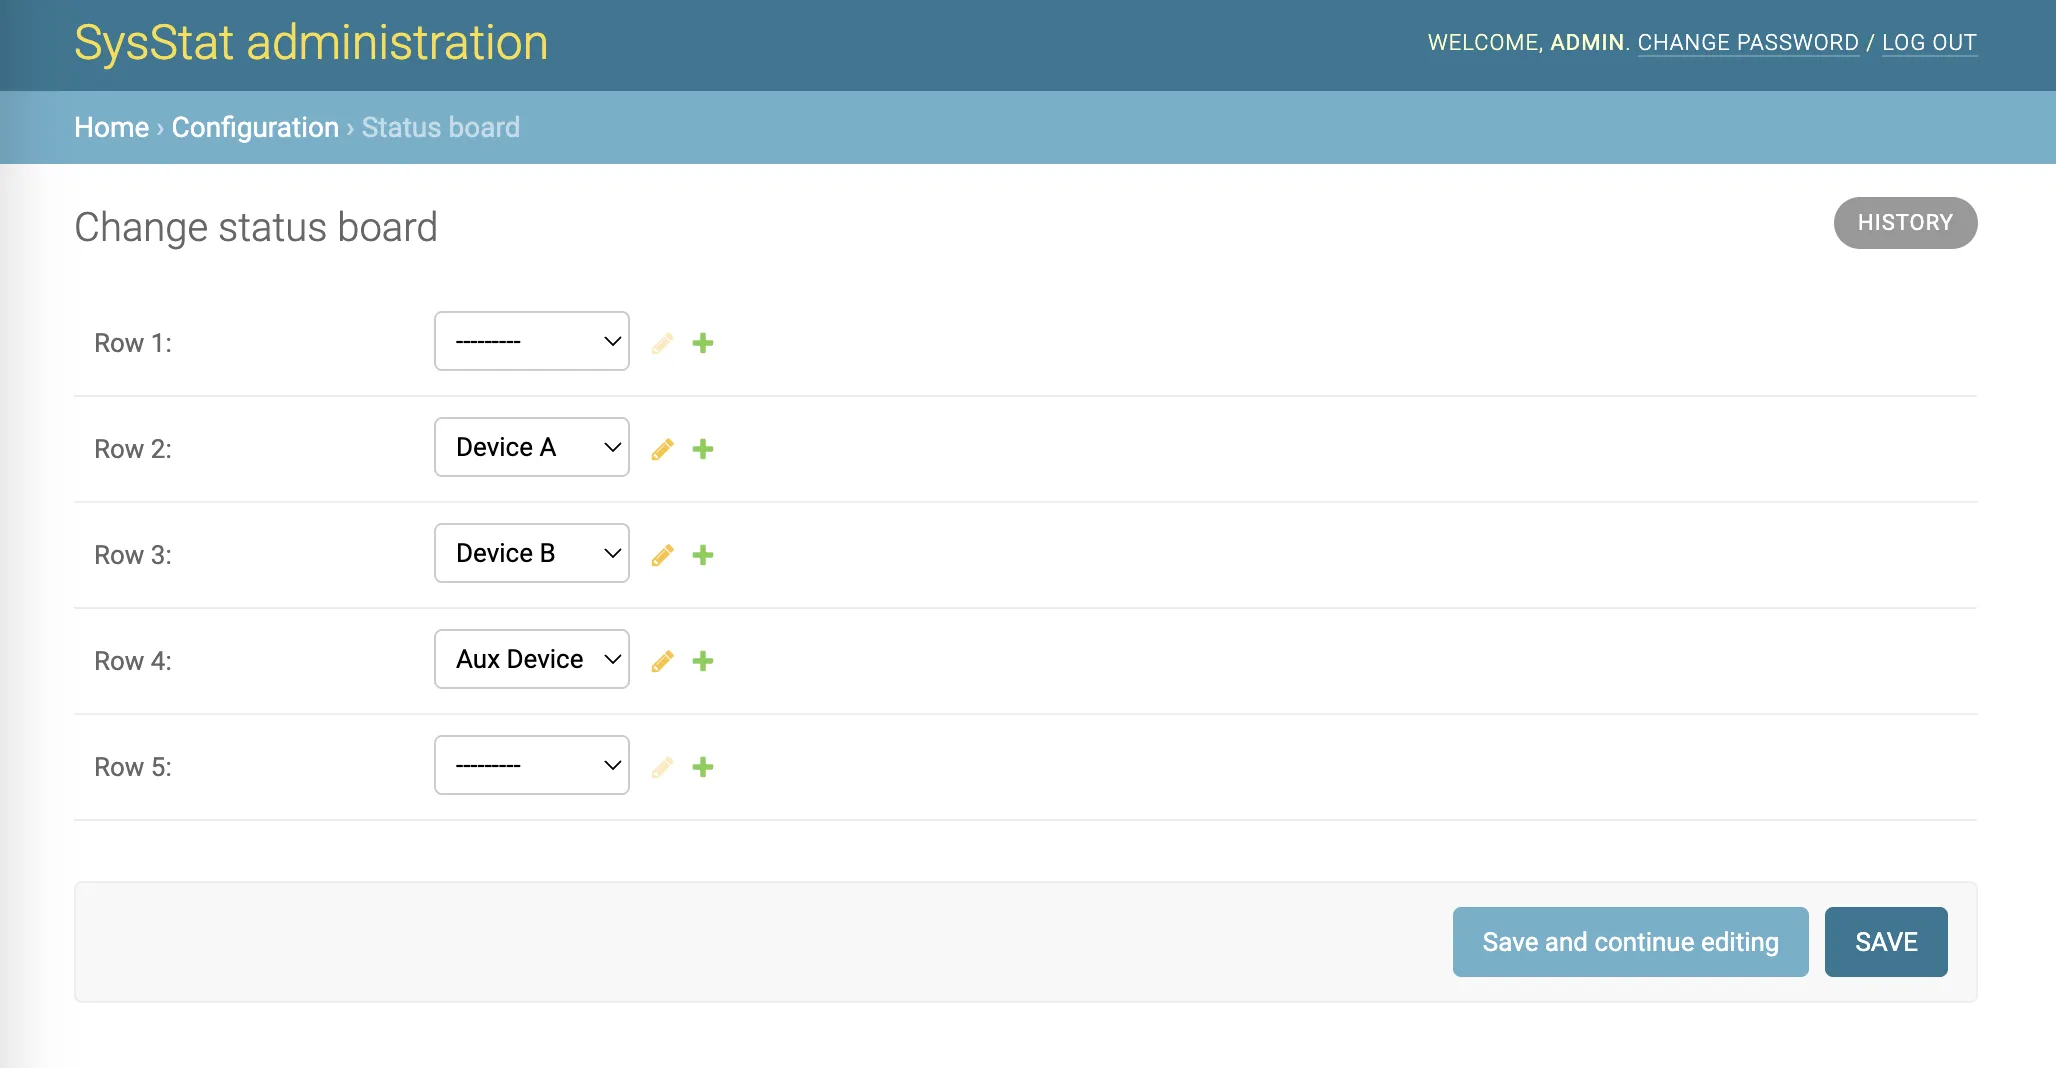
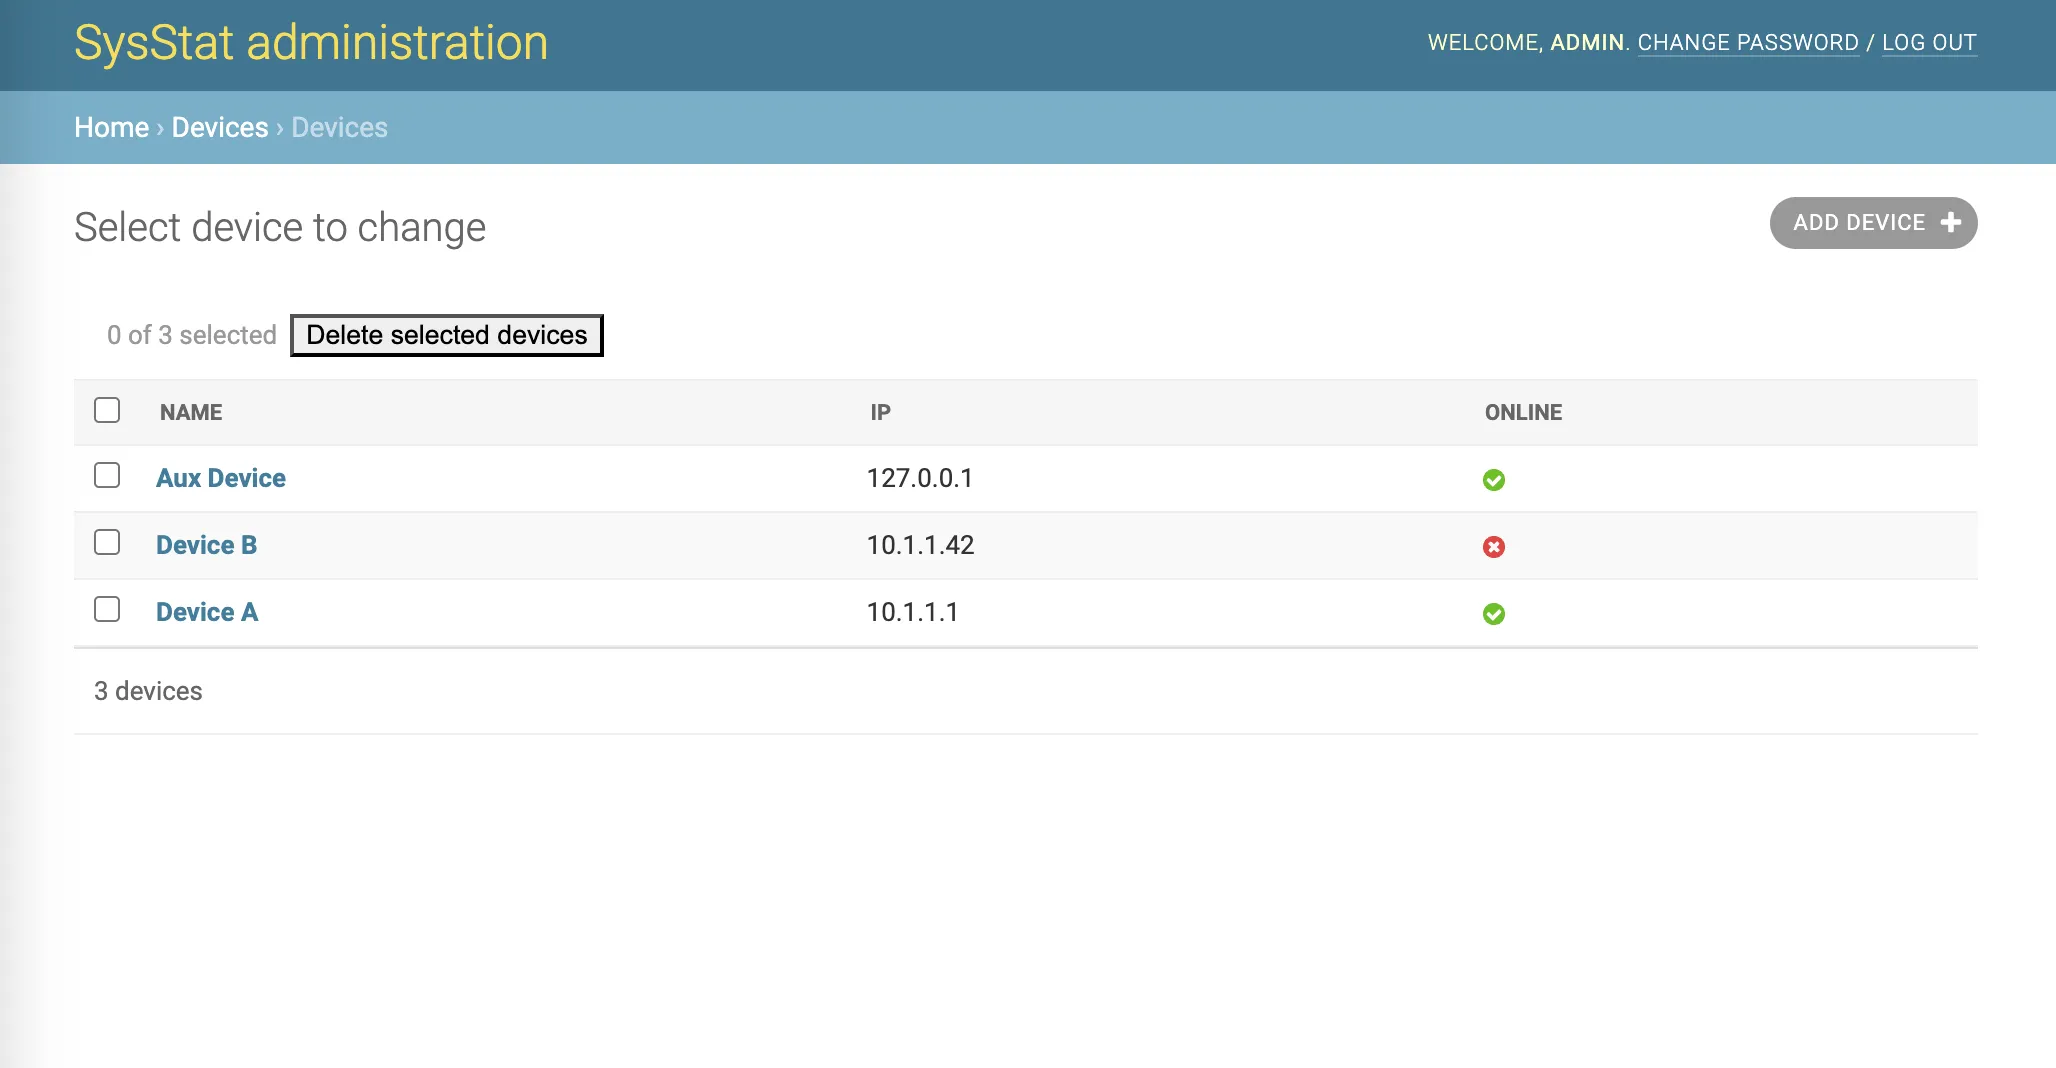
The web interface is the Django admin with minimal visual polish — function over form. Network config (DHCP or static), per-device IPs and thresholds, which LED strip represents which device — all of it lives in admin screens the installer reaches on the box's mDNS hostname. No custom front-end, no SSH, no developer in the loop when a site needs retuning.
One-line installer, years of life
One-line installer. curl ... | bash on a fresh Raspbian image provisions the whole box end-to-end: compiles Python 3.8, installs the Django app as a systemd service, sets up a static IP with mDNS discovery, and starts everything. Going from a blank SD card to a working monitor takes one command.
tmpfs logs. Logs live in RAM, not on the SD card. When a box sits unattended in the field for years, log churn is what kills the card first; moving it to tmpfs pushes that failure mode off the table.
Pluggable reader. The active device-reader class is a dotted Python path in Django settings and is dynamically imported at startup — the same pattern Django uses for middleware. A fake reader runs during local development; the real one runs on hardware. Swapping readers for a different monitoring surface (not just ICMP) is a settings change.